Tracing Gradle task execution
01 August 2018
Gradle provides two built-in mechanisms for tracing your build: --profile and --scan. The former produces a simple HTML report of task execution times. You can get a rough idea of where time was spent but are unlikely to glean any real insights. The latter sends a detailed report to Gradle’s servers (or to a Gradle Enterprise installation) with much more granular information. Task details are rendered on a concurrent timeline corresponding to their execution. For CI builds, I tend to want something more granular than --profile but I don’t like the idea of sending details of every build to Gradle with --scan. It seems entirely needless considering their plugin has all of that information locally but chooses to render it remotely.
The Gradle profiler project started a few years ago as a way to deterministically measure build speeds. By creating scenarios such as an ABI-breaking change, ABI-compatible change, Android resource change, etc., the tool can run these scenarios multiple times to first warm up the JVM and then to produce an accurate picture of what gets executed. It offers integrations and outputs for use with popular JVM-based performance analysis tools such as YourKit and Java Flight Recorder.
For CI builds, executing through the Gradle profiler would be an annoying abstraction to use. We can instead use it for inspiration and run its integrations on individual builds.
Java Flight Recorder can be used on individual Gradle builds with the jcmd binary in the JDK and with flags to java specified on the org.gradle.jvmargs in your gradle.properties. There are even Gradle plugins which offer to start and stop the recording automatically. We can then open the resulting .jfr file in Java Mission Control or use a command-line tool to convert it into a flamegraph.
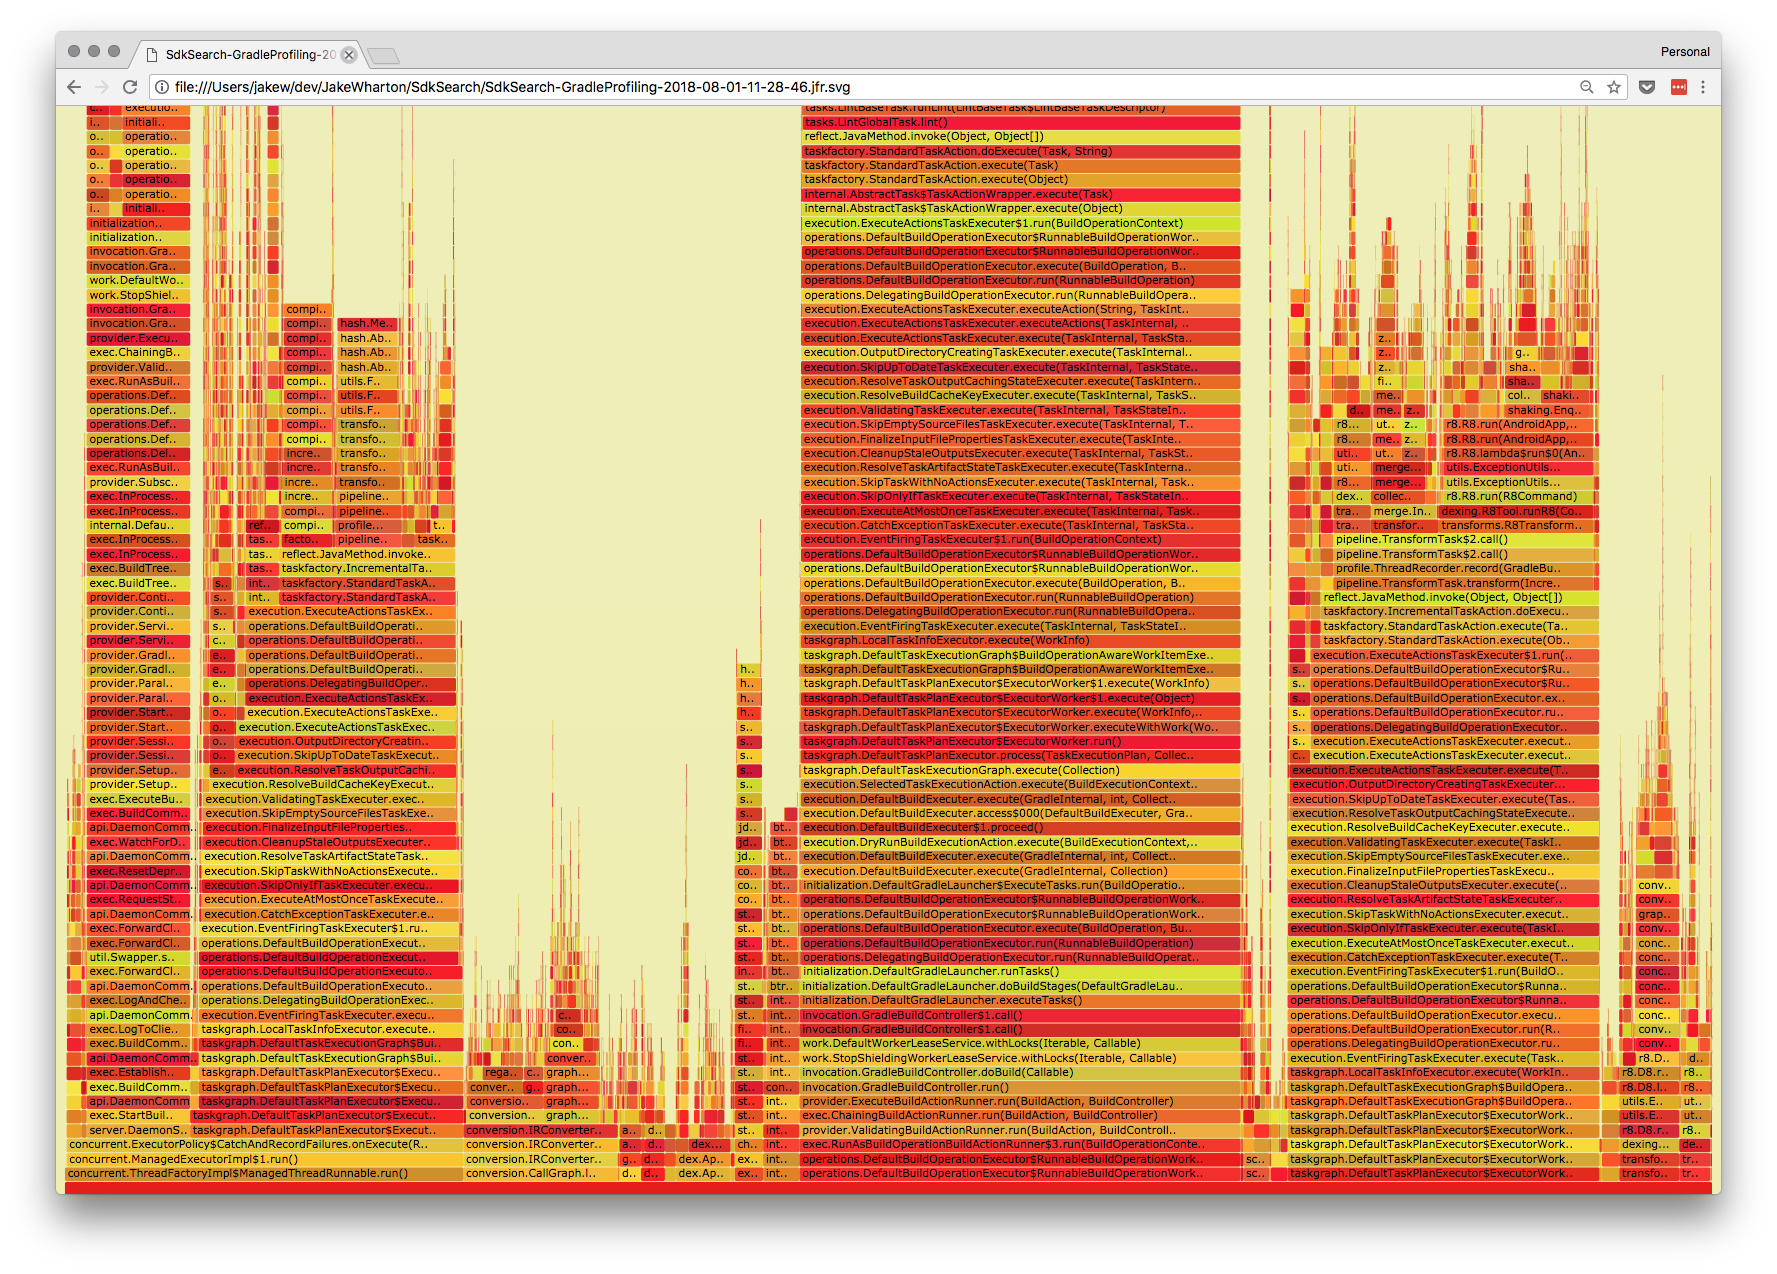
The flamegraph can show where time is being spent inside of tasks over the course of the build. The stacks aren’t correlated to a task, though, so it’s important to remember that you’re looking at the larger picture. This also doesn’t handle tasks which communicate with their own daemons such as the Kotlin compiler.
While this produces a pretty output, its utility is small and the Gradle plugin integration is not the most stable. I would refrain from using this on CI as result unless you’re going to build out a strong integration with jcmd directly. These visualizations work well when you have a small subset of tasks to run rather than when your entire project is being built.
The Gradle profiler also includes support for Chrome traces. This output will be familiar to Android users who have used the systrace tool. Again we can integrate this into our builds without jumping through the Gradle profiler.
The code for producing a Chrome trace lives inside the Gradle profiler repository. Clone and build the project which will produce a jar at subprojects/chrome-trace/build/libs/chrome-trace.jar. Copy this jar into the gradle/ directory of your project. This jar contains a plugin which can be applied inside a Gradle initialization script.
// init.gradle

initscript {
  dependencies {
    classpath files('gradle/chrome-trace.jar')
  }
}

rootProject {
  def date = new java.text.SimpleDateFormat("yyyy-MM-dd-HH-mm-ss").format(new Date())
  ext.chromeTraceFile = new File(rootProject.buildDir, "reports/trace/trace-${date}.html")
}

apply plugin: org.gradle.trace.GradleTracingPlugin
When invoking Gradle we need to reference this script and also pass a flag to enable the tracing.
$ ./gradlew --init-script init.gradle -Dtrace build
This will produce a trace file at build/reports/trace/trace-(date).html which you can open in Chrome and navigate using the arrow keys and A-S-D-W keys.
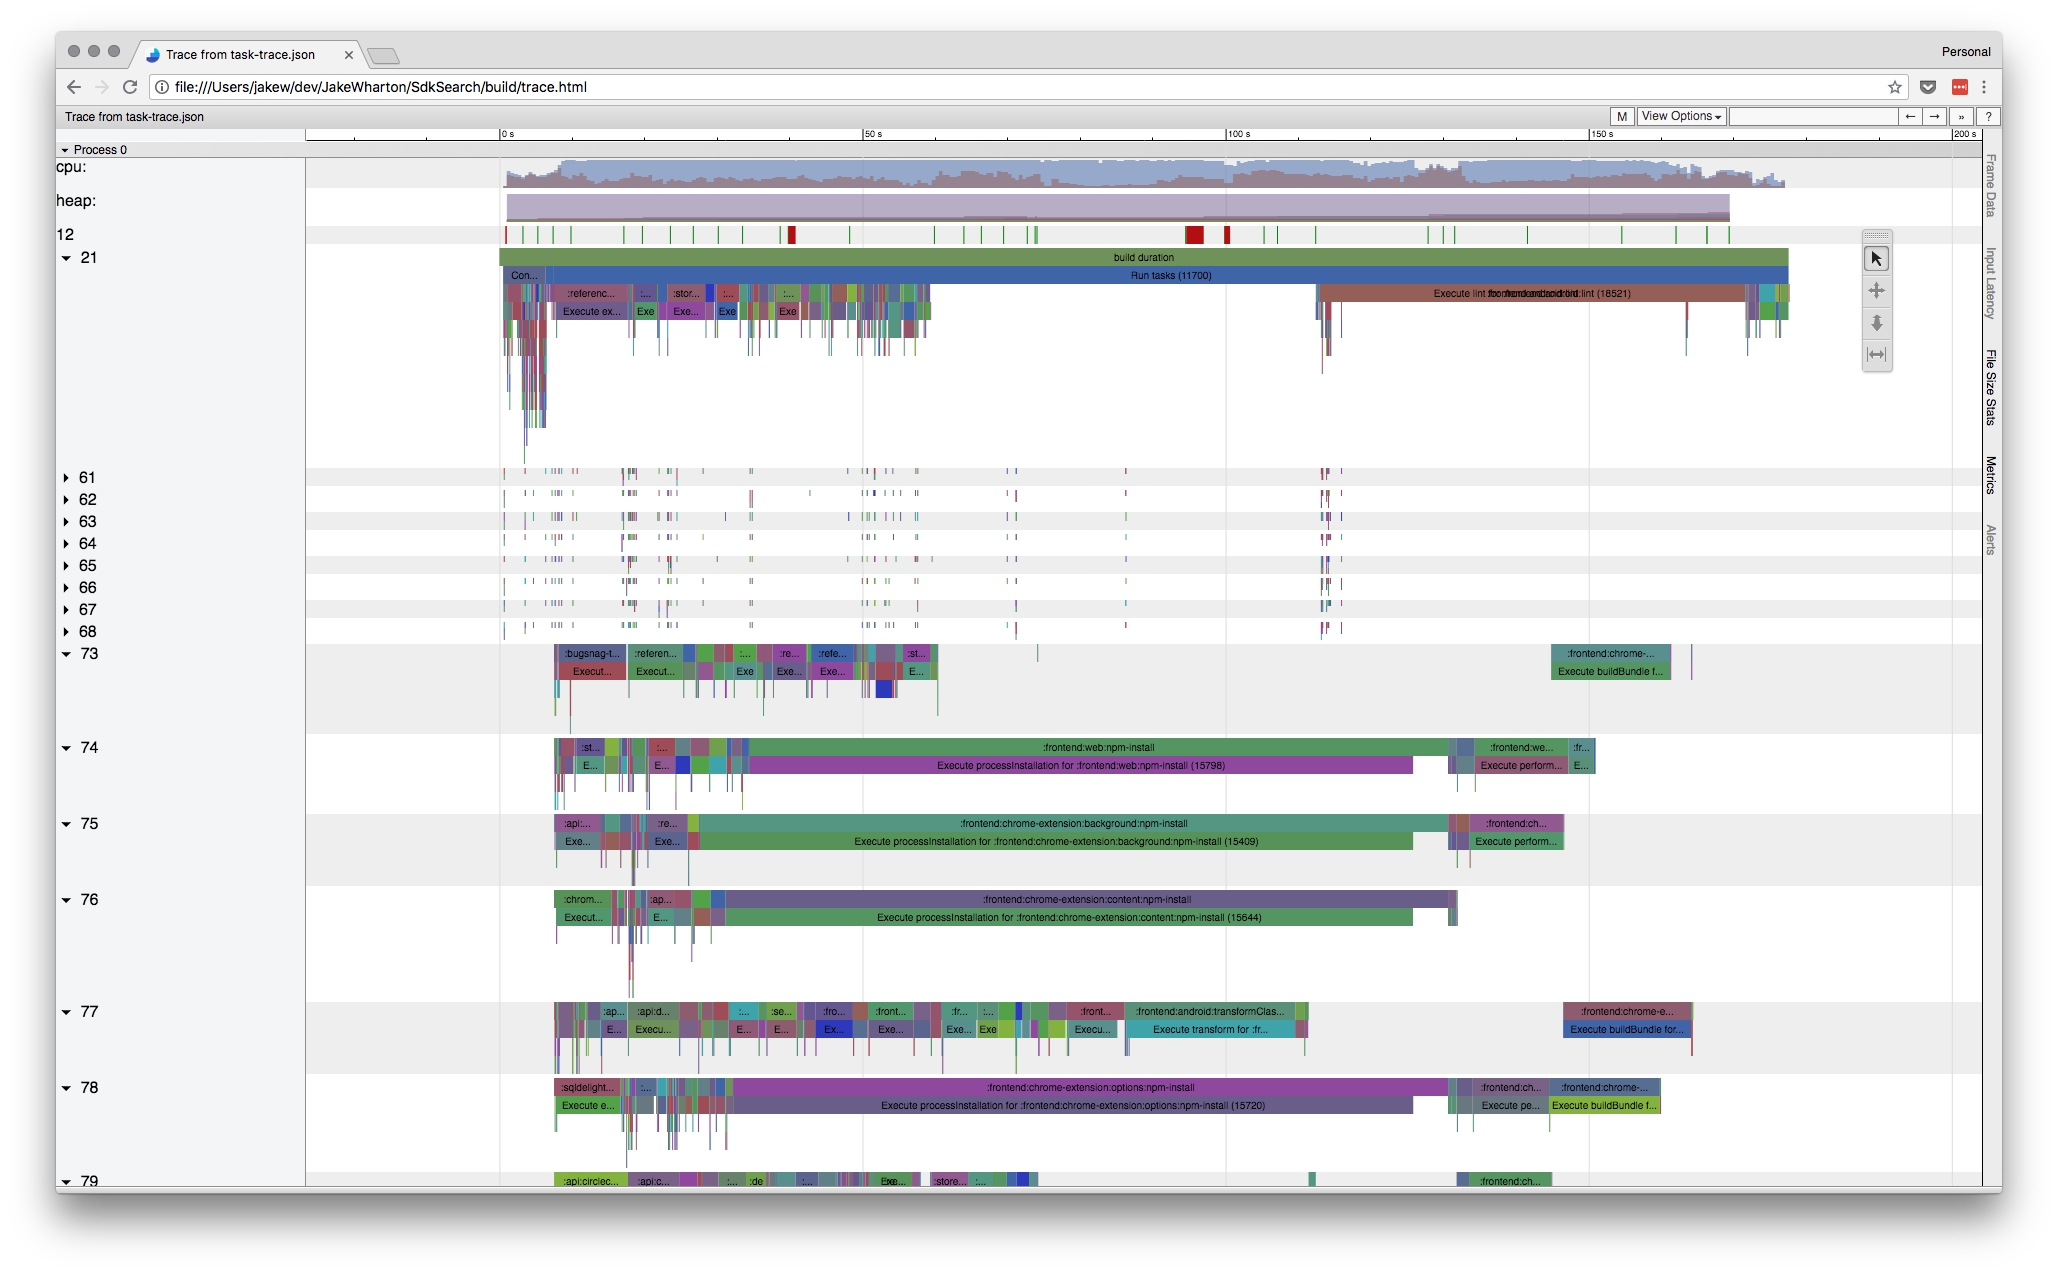
The trace gives a picture of concurrent task execution and timings therein. There is very little here that isn’t in the --profile report, but it’s presented in a manner that gives you more context. The most notable and welcome addition is that of CPU load, heap size, and GC events.
Unfortunately, the granularity per-task is near zero. There are no insights into workers that operate as part of a task. We cannot get flame graphs of the call stacks inside of a task.
I have added this to SDK Search’s CI builds in addition to the other reports it already generates if you’d like to see a full integration: https://github.com/JakeWharton/SdkSearch/commit/3cc9bd8bc9741cf8459bf975a186e0c36e5481d8.
Neither is perfect but both can be useful in different situations. Hopefully in the future visibility into workers will be added to the Chrome trace. Figuring out how to merge the Java Flight Recorder data into the Chrome trace would also be an amazing addition. For now, having the Chrome trace run on CI gives a good picture of how the build is performing and then Java Flight Recorder can be used either manually or with the Gradle profiler to dig into individual task performance.
Here are the four tracing outputs of a single build:
— Jake Wharton